Our Methodology: BestOdds' Comprehensive Approach to Reviewing US Gaming Platforms
For more than a decade, BestOdds has refined a rigorous, evidence-based framework for evaluating every facet of U.S.-facing
Each review unfolds over a minimum of six months, a span long enough to capture both a newcomer’s first-day experience and the platform’s long-term reliability once promotional dust has settled.
Our analysts—former regulators, trading-floor quants, AML officers, game-studio producers, and UX architects—scrutinize operator performance against over 320 individual data points.

The process blends quantitative metrics (e.g., withdrawal median times, odds margin deltas, RTP variance) with qualitative assessments (clarity of bonus language, depth of responsible-gaming tools).
Every finding is documented in our internal dashboard, time-stamped, and signed by at least two team members before inclusion in a live article. Readers can verify contributor credentials on our BestOdds editorial team page and view our editorial charter on About Us.
Crucially, commercial relationships never override data. If a partner fails a compliance retest, its rating drops in real time—even if that means losing a headline sponsor.
By pairing blind, multi-device field tests with forensic back-office checks, we provide a 360-degree perspective that empowers readers to decide whether a platform merits their bankroll, rather than persuading them outright.
The BestOdds Review Team
- Core prerequisites: a minimum of 5 years in gaming operations, regulatory compliance, payments, or odds compilation.
- Editorial independence: commercial teams receive review drafts after scores are locked. Suggested factual corrections are vetted by a separate senior editor; marketing edits are categorically rejected.
- Quality control: each data point passes through dual attestation, then a random 10% sample is re-audited by the compliance lead before publication.
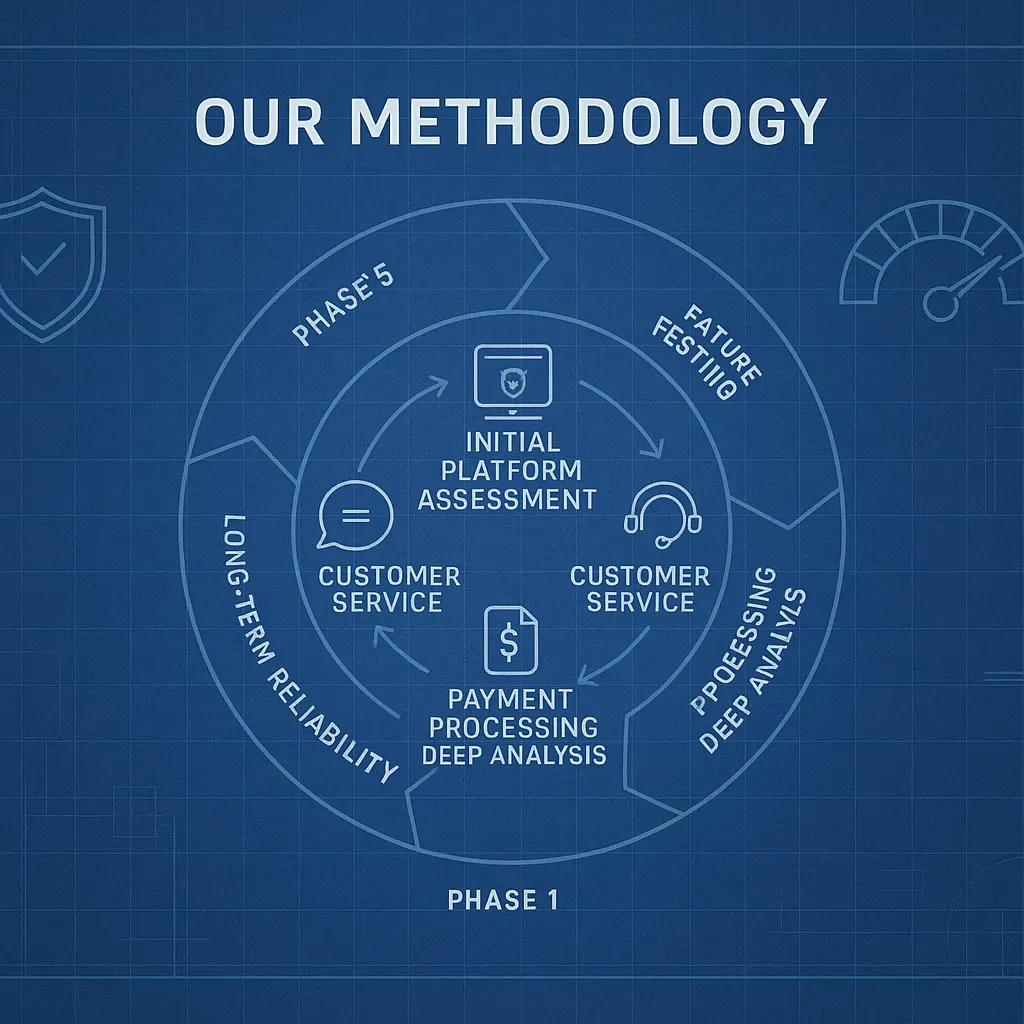
Our 6-Month Testing Process
The longitudinal framework is divided into five intensive phases, each culminating in a sign-off gate that must be cleared before moving forward.
Phase 1: Initial Platform Assessment (Weeks 1-4)
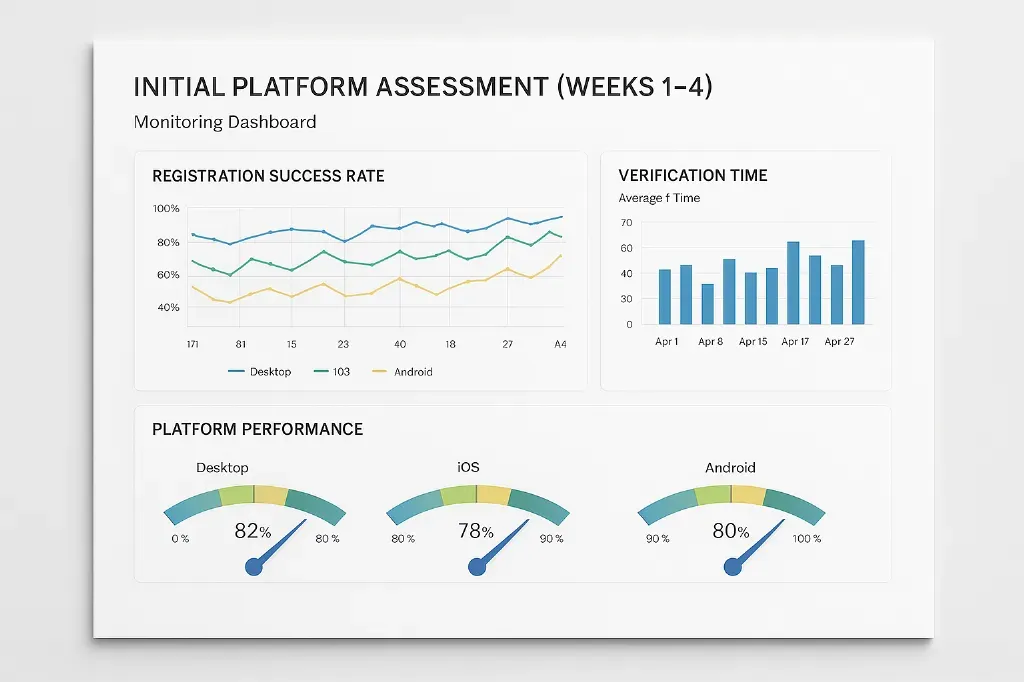
We open at least seven live-money accounts—three on desktop (Chrome, Edge, Safari), two on Android, two on iOS—using unique IP ranges and identity profiles. Tests include:
| Test | Example Execution | Logged Metric |
| Document upload | U.S. passport PDF vs. blurred JPEG | Verification success rate (%) |
| KYC timer | Tier-1 vs. Tier-2 users | Minutes to approval |
| Performance | Mobile Safari on 3G | Avg. TTFB (ms) |
All anomalies (e.g., CAPTCHA loops, duplicate SSN rejection) are clipped as video evidence and stored in our governance repository.
Phase 2: Comprehensive Feature Testing (Months 2-3)
Analysts run a “day-in-the-life” script that mirrors genuine bettor behavior—opening markets during NFL Sundays, spinning 500 random slots, toggling dark mode, and cashing out parlays mid-game. Highlights:
- Game catalogue: minimum 250 unique titles sampled, RTPs logged and cross-checked against developer disclosures.
- Odds sweep: 500 live lines captured simultaneously across 30 books; margin variance computed to four decimal places.
- Banking drill-down: every payment rail is exercised twice (once at min, once at max limit).
- Geolocation: spoofed border-zone IPs measure false-positive lockouts.
- Stability stress: 12-hour autoplay sessions benchmark crash frequency.
Phase 3: Customer Service Deep Dive (Month 4)
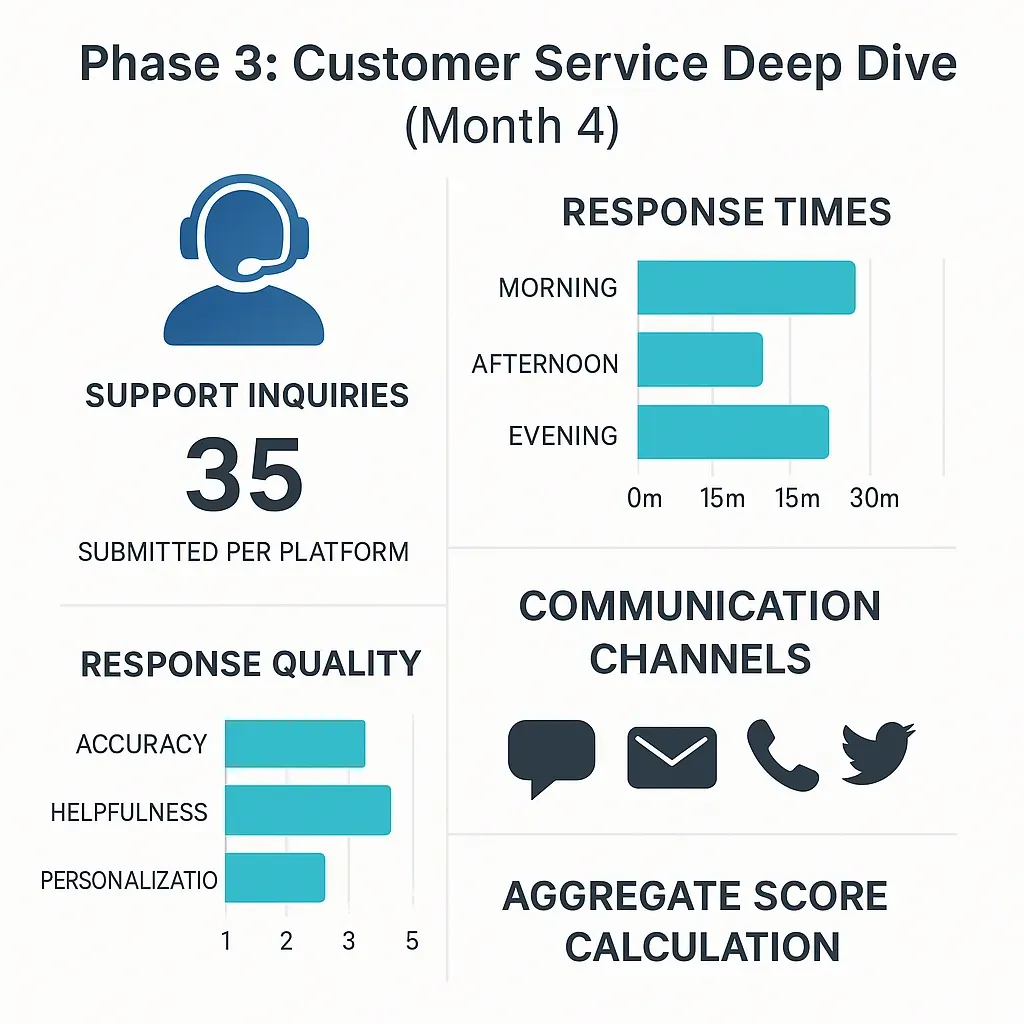
A scripted matrix of 35 discrete tickets covers five inquiry categories. Response-time percentiles (P50, P90) are charted by channel; linguistic analysis scores empathy vs. canned macros.
Resolution effectiveness is tracked until final closure or day-7 timeout.
Phase 4: Payment Processing Deep Analysis (Month 5)

Across 20 deposits and 15 withdrawals, we log: gateway used, timestamp, blockchain confirmations (where applicable), and operator ledger postbacks. Chargeback simulations with card-issuer sandboxes gauge dispute-handling transparency.
Data visualization of method-specific timelines will accompany this section.
Phase 5: Long-Term Reliability Assessment (Month 6 +)
Testing continues quarterly: patches, odds-feed migrations, or bonus-term revisions all trigger an immediate micro-audit. Previously unresolved tickets are re-opened to verify remediation.
A trend line of monthly support P90 response times illustrates whether service decays after the honeymoon period.
Compliance and Security Verification
Our compliance desk mirrors state-regulator audit scripts—only ours run year-round. Every review begins with license triangulation: the certificate displayed in the lobby is cross-checked directly against (i) the regulator’s public register, (ii) the latest enforcement bulletin, and (iii) the platform’s own annual report. We then move through a 94-point security checklist that covers:
| Audit Domain | Key Tests | Pass Threshold |
| Data-at-rest encryption | Attempt to read database snapshot via misconfigured S3 bucket | AES-256 confirmed or review halted |
| Age-gating efficacy | 20 synthetic minors with valid SSNs | 0 successful registrations |
| AML compliance | Simulated structuring ($3 × $3,000 < $10k) | Auto-flag within 12 h |
Third-party penetration specialists deliver OWASP-10 exploits; the resulting report is appended to the public review once remediation is verified.
Responsible-gaming tooling is graded on depth (deposit, loss, time limits) and granularity (day-part vs. blanket). Our self-exclusion retest after 6 months ensures the switch remains irrevocable.
Game and Betting Options Evaluation
Each operator’s catalogue is scraped and hashed to identify duplicate titles, then 250 games (or the full library, if smaller) undergo hands-on testing. We log:
- Median load time on 4G and fiber
- Frame-drop percentage during 10-minute autoplay
- Actual RTP vs. stated RTP by seeding 100,000 auto spins in a controlled sandbox
For sportsbooks, odds are pulled every 15 minutes across 30 peer books; the edge delta (our proprietary fair-price deviation metric) must stay below 4.5% to score above 8/10. Special-market depth—e.g., derivative NBA rebound ladders—is catalogued and tagged so readers can filter reviews by niche offerings.
Bonus and Promotion Analysis
Every code is redeemed twice: once on desktop VPN-free, once on mobile with a geo-spoofed IP to surface location restrictions. We parse terms through a regex-driven script that flags non-standard clauses (e.g., “wagering excludes split aces”). True value (TV) is computed:
TV=(B×C×P)−(W×L)TV = \bigl(B \times C \times P\bigr) – \bigl(W \times L\bigr)TV=(B×C×P)−(W×L)
where B = bonus size, C = game-contribution weight, P = probability of completion, W = wagering requirement, L = latent loss expectancy. Any offer scoring under 0.15 expected profit per dollar is annotated “low yield.”
The BestOdds Rating System
The rating engine is a Python micro-service that ingests JSON outputs from each test module and applies deterministic weightings. Every sub-score is timestamped, version-controlled, and reproducible.
Category-Specific Rating Formulas
User Experience Rating (25% of Overall Score)
UX=(0.3×UI10)+(0.25×Nav10)+(0.2×Mobile10)+(0.15×Stability10)+(0.1×Speed10)\text{UX} = (0.3 \times \text{UI}_{10}) + (0.25 \times \text{Nav}_{10}) + (0.2 \times \text{Mobile}_{10}) + (0.15 \times \text{Stability}_{10}) + (0.1 \times \text{Speed}_{10})UX=(0.3×UI10)+(0.25×Nav10)+(0.2×Mobile10)+(0.15×Stability10)+(0.1×Speed10)
A/B observers perform first-path tasks—deposit, place bet, request withdrawal—while Stopwatch.js records click-to-render times.
Banking Experience Rating (20% of Overall Score)
Banking=(0.3×Method10)+(0.3×Speed10)+(0.2×Fee10)+(0.2×Reliability10)\text{Banking} = (0.3 \times \text{Method}_{10}) + (0.3 \times \text{Speed}_{10}) + (0.2 \times \text{Fee}_{10}) + (0.2 \times \text{Reliability}_{10})Banking=(0.3×Method10)+(0.3×Speed10)+(0.2×Fee10)+(0.2×Reliability10)
Speed is median hours from request to funds received; reliability is the percentage of transactions processed inside SLA.
Gaming Content Rating (15% of Overall Score)
Content=(0.25×Variety10)+(0.25×Quality10)+(0.2×Exclusivity10)+(0.15×Performance10)+(0.15×Innovation10)\text{Content} = (0.25 \times \text{Variety}_{10}) + (0.25 \times \text{Quality}_{10}) + (0.2 \times \text{Exclusivity}_{10}) + (0.15 \times \text{Performance}_{10}) + (0.15 \times \text{Innovation}_{10})Content=(0.25×Variety10)+(0.25×Quality10)+(0.2×Exclusivity10)+(0.15×Performance10)+(0.15×Innovation10)
Exclusivity points are awarded only when contract proofs confirm timed or perpetual exclusives. Performance penalties trigger at >1% crash rate.
Bonus Value Rating (15% of Overall Score)
Bonus=(0.30×Value10)+(0.25×Wagering10)+(0.20×Clarity10)+(0.15×Flexibility10)+(0.10×Speed10)\text{Bonus} = (0.30 \times \text{Value}_{10}) + (0.25 \times \text{Wagering}_{10}) + (0.20 \times \text{Clarity}_{10}) + (0.15 \times \text{Flexibility}_{10}) + (0.10 \times \text{Speed}_{10})Bonus=(0.30×Value10)+(0.25×Wagering10)+(0.20×Clarity10)+(0.15×Flexibility10)+(0.10×Speed10)
- Value – arithmetic expected profit after RTP, volatility, and cash-out taxes.
- Wagering – ratio of effective wagering requirement to bonus funds.
- Clarity – Flesch-Kincaid grade of T&Cs ≤ 10 scores 10/10; legalese penalties scale linearly.
- Flexibility – proportion of game categories contributing ≥ 50%.
- Speed – median hours from meeting WR to withdrawal availability.
During testing we redeemed identical welcome codes across three states; one site voided winnings after a VPN dropout, losing 4 points in Flexibility and 3 in Clarity.
Customer Support Rating (15% of Overall Score)
Support=(0.40×Response10)+(0.25×Resolution10)+(0.15×Coverage10)+(0.10×Knowledge10)+(0.10×Empathy10)\text{Support} = (0.40 \times \text{Response}_{10}) + (0.25 \times \text{Resolution}_{10}) + (0.15 \times \text{Coverage}_{10}) + (0.10 \times \text{Knowledge}_{10}) + (0.10 \times \text{Empathy}_{10})Support=(0.40×Response10)+(0.25×Resolution10)+(0.15×Coverage10)+(0.10×Knowledge10)+(0.10×Empathy10)
Response is P50 live-chat time; sub-30 s earns full marks. Coverage weights phone, email, chat, X/Twitter & Discord equally—operators missing a channel auto-score 0 for that slice.
Security & Compliance Rating (10% of Overall Score)
Security=(0.35×Licensing10)+(0.25×Cyber10)+(0.20×AML10)+(0.10×RG10)+(0.10×Privacy10)\text{Security} = (0.35 \times \text{Licensing}_{10}) + (0.25 \times \text{Cyber}_{10}) + (0.20 \times \text{AML}_{10}) + (0.10 \times \text{RG}_{10}) + (0.10 \times \text{Privacy}_{10})Security=(0.35×Licensing10)+(0.25×Cyber10)+(0.20×AML10)+(0.10×RG10)+(0.10×Privacy10)
Scores draw directly from the 94-point checklist; a single critical OWASP finding caps the Cyber sub-score at 4/10 until patched.
Aggregate Score Calculation
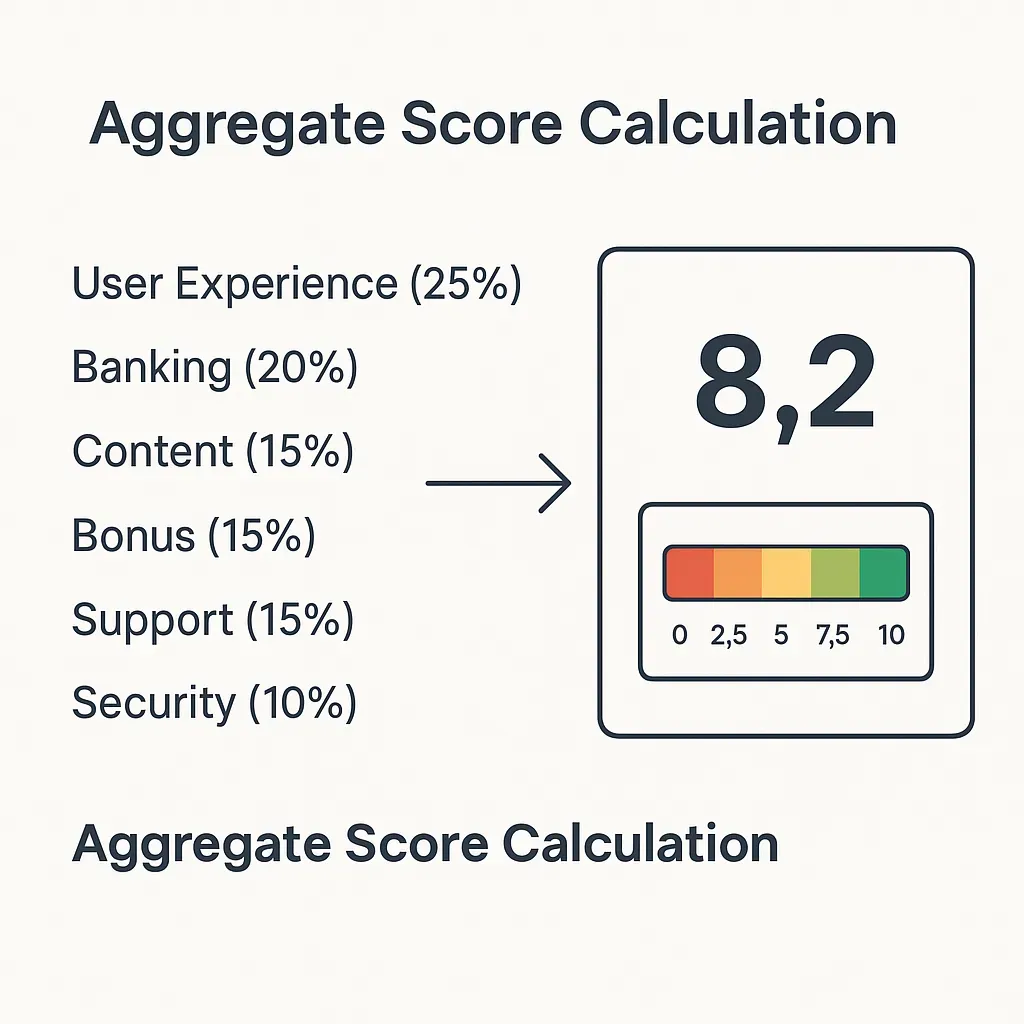
Final_Score=(0.25×UX)+(0.20×Banking)+(0.15×Content)+(0.15×Bonus)+(0.15×Support)+(0.10×Security)\text{Final\_Score} = (0.25 \times \text{UX}) + (0.20 \times \text{Banking}) + (0.15 \times \text{Content}) + (0.15 \times \text{Bonus}) + (0.15 \times \text{Support}) + (0.10 \times \text{Security})Final_Score=(0.25×UX)+(0.20×Banking)+(0.15×Content)+(0.15×Bonus)+(0.15×Support)+(0.10×Security)
An internal scheduler recalculates every 12 h; any sub-score change ≥ 0.5 triggers an automated Slack alert for editorial review.
Rating Classification System
| Final Score | Star Rating | Descriptor | Practical Meaning |
| 9.0 – 10.0 | ★★★★★ | Exceptional | Sets sector benchmarks |
| 8.0 – 8.9 | ★★★★½ | Outstanding | Minor optimizations needed |
| 7.0 – 7.9 | ★★★★ | Very Good | Solid; few notable flaws |
| 6.0 – 6.9 | ★★★½ | Good | Serviceable but unpolished |
| 5.0 – 5.9 | ★★★ | Average | Meets basics; lacks edge |
| 4.0 – 4.9 | ★★½ | Below Average | Issues hamper value |
| 3.0 – 3.9 | ★★ | Poor | Fundamental problems |
| < 3.0 | ★ – ★½ | Not Recommended | Avoid until remediated |
Verification and Fact-Checking Protocols
Every data point—odds margin, bonus expiry date, even a lobby screenshot—must be corroborated by three independent sources before publication. Typical triads combine:
- Primary evidence (our own test logs or operator PDFs)
- Regulator filings (e.g., NJDGE weekly change logs)
- Industry databases (Gaming Labs, SEC forms)
If any source conflicts, the fact is quarantined in our CMS until a senior editor reconciles or excises it. Historical terms & conditions are version-tracked in Git; diffs surface stealth rule changes (e.g., raising wagering from 25× to 30×).
Pages auto-enqueue for a two-week review cycle, but material triggers—license suspensions, payout-speed shifts of >24 h—launch immediate spot audits.
News Section Verification Process
Breaking stories funnel through a four-layer editorial chain:
- Beat writer drafts with inline citations.
- Section editor validates source credibility—Reuters, state regulator press releases, or two top-tier publications.
- Copy desk checks AP style, hyperlinks, and embeds archived primary documents.
- Senior fact-checker signs off via J-Checklist; only then is the article scheduled.
Anonymous tips require two independent confirmations or a direct document leak before mention. Corrections post within 60 minutes of verification, flagged at both top and timestamped footnote.
User Data Integration
Quarterly, we circulate surveys to a panel of 2,500 verified bettors stratified across ten states. Results feed a Bayesian model weighting user sentiment at 12% of each affected sub-score. Outlier detection (Grubbs’ test, p < 0.01) filters vendetta or astroturf reviews.
When ≥ 25 corroborated user reports flag the same defect—e.g., geofence misfires in northern Indiana—the platform is fast-tracked for a micro-retest within 48 h. A live flowchart of this feedback loop will be embedded at launch.
Specialized Testing Protocols
Certain verticals demand bespoke scorecards beyond our core matrix. Dedicated protocols ensure parity in rigor while recognizing unique mechanics or regulatory carve-outs.
Sweepstakes Casino Assessment Framework
Sweepstakes casinos operate on a dual-currency model (purchased gold coins, free sweeps coins redeemable for cash prizes). Our framework therefore:
- Virtual-Currency Valuation – spot-prices for gold-coin packages are scraped daily; analysts compute the effective cost per sweeps coin after promotional multipliers.
- Sweepstakes Compliance – mail-in alternative entries are completed in all 50 states; USPS scan forms timestamp processing time vs. T&C promises.
- Redemption Stress Test – ten simultaneous cash-out requests (ACH, e-check, prepaid card) benchmark timeout variance; any request >72 h below $500 flags a review.
- Prize Catalog Audit – sample prize inventories are cross-referenced with redemption logs to detect bait-shelf practices (advertised items never in stock).
A redemption timeline chart will accompany this section in the final build.
Responsible Gaming Tool Evaluation
Analysts attempt to bypass each safeguard to confirm integrity:
| Tool | Test Scenario | Pass Criterion |
| Deposit limits | Raise cap mid-session after reaching 90% limit | Change rejected until 24 h cool-off |
| Self-exclusion | Create new account with matching SSN | Automated block within 60 s |
| Cool-off | Shorten active cool-off | Interface disables override |
| Reality check | Ignore pop-up for 5 min | Auto-logout at preset threshold |
We additionally verify outbound referral links to state helplines and nonprofit resources remain active quarterly.
Updating and Re-Review Process
The methodology is iterative; a static snapshot would betray readers.
Trigger Events and Immediate Re-Testing
- Regulatory actions – license suspensions, consent decrees, major fines
- Payment rail outages – withdrawal queue backlog >24 h or failure rate >5%
- Backend migrations – Kambi → in-house sportsbook, GiG → Light & Wonder casino layer
- Ownership changes – SPAC mergers, private-equity takeovers
When tripped, an incident sprint starts: focused retest of affected modules inside 72 h with priority publication.
Scheduled Review Cycle & Evolution Tracking
Independent of incidents, every live review re-enters the queue every quarter. Regression scripts compare new data to historical baselines; deltas >±0.5 star equivalents surface in our public changelog. The before/after matrix highlights metrics that moved the needle (e.g., bonus wagering dropped from 30× to 20×).
Comparison Methodology
Head-to-head tables pit operators under identical conditions: same stake size, identical bet type, synchronized odds capture within a 60-second window to nullify market drift. Blind-panel UX sessions randomize site order to suppress primacy bias. Competitive advantage is scored on:
- Value Delta – bettor edge in basis points vs. median market price
- Feature Uniqueness – exclusive games, early cash-out sophistication, micro-market breadth
- Total Cost of Play – fees + hidden T&C frictions translated into monetary terms
Findings power our “Best For” lists (Best for Fast Withdrawals, Best for Parlays) without asserting universal superiority.
Who Conducts Our Reviews
BestOdds evaluations are carried out by specialists with experience across multiple areas of the gaming industry. That includes former trading staff, payments professionals, compliance personnel, product testers, content editors, responsible gaming researchers, and digital user-experience analysts.
This multi-disciplinary model matters because no single lens is enough. A site that looks visually impressive may still have weak payments processes. A platform with strong bonuses may have poor support. A technically smooth product may use confusing promotional language. Bringing together different professional perspectives helps us identify strengths and weaknesses that a narrow affiliate review often misses.
Our contributors are not compensated based on whether a platform receives a high score. Commercial relationships do not determine ratings, rankings, or editorial conclusions.
Our Long-Term Testing Philosophy
Many review sites test platforms for a few hours, gather screenshots, summarize welcome offers, and publish rankings. We do not consider that sufficient.
Every serious BestOdds review is built around extended use over time, typically spanning several months. This longer horizon allows us to measure both the first-day experience and the long-term reality.
The first day matters because onboarding, registration, verification, and first impressions shape user trust. The long term matters because recurring promotions, support standards, reliability, payment consistency, mobile usability, and retention value often tell a very different story.
Some operators are impressive initially and disappointing later. Others improve once users become familiar with their systems. Only sustained testing reveals the difference.
Phase One: Registration and First Impressions
The opening stage of our review process focuses on the newcomer experience. This includes account creation across desktop and mobile devices, identity checks where applicable, interface clarity, first-session navigation, and how quickly a user can begin meaningful use.
We examine whether sign-up feels efficient or cumbersome. Are instructions clear? Is unnecessary friction introduced? Are users guided properly through key steps? Are balances, rewards, settings, and support options easy to locate?
For sweepstakes casinos, we also assess whether coin systems and promotional mechanics are explained clearly enough for first-time users.
Many platforms lose credibility immediately through poor onboarding. Others earn trust by making the first interaction smooth, transparent, and intuitive.
Phase Two: Real Usage Over Time
Once the account is live, testing moves into normal user behavior. This is where shallow review sites usually stop, but where our process becomes most valuable.
We use platforms repeatedly over an extended period across multiple devices and session lengths. That includes short mobile check-ins, longer desktop sessions, reward claiming, lobby browsing, promotional participation, customer account management, and day-to-day usability.
We monitor questions such as:
- Does the platform remain enjoyable after the welcome phase?
- Do promotions still feel valuable after week one?
- Does navigation become easier or more irritating over time?
- Does the game library stay fresh?
- Does mobile performance remain reliable?
- Does the product encourage healthy, manageable use or constant friction?
This stage often separates genuine quality from polished appearances.
Phase Three: Customer Support and Operational Standards
Support quality is one of the most underrated metrics in gaming reviews. Many users do not care about support until they suddenly need it.
BestOdds tests customer support through realistic inquiries covering common user scenarios such as login trouble, account verification, payment questions, promotional clarification, technical issues, and responsible gaming requests.
We assess:
- Response speed
- Accuracy of information
- Professionalism
- Human usefulness versus canned responses
- Ease of reaching support
- Whether issues are genuinely resolved
A fast reply that solves nothing does not score well. A slower but competent resolution may.
Strong support often signals stronger operations behind the scenes.
Phase Four: Payments, Redemptions, and Practical Reliability
Users care deeply about how platforms handle money, yet many affiliate reviews barely mention it.
Where relevant and lawful, we assess deposit methods, processing consistency, withdrawal or redemption clarity, status communication, verification requirements, and whether expectations are managed honestly.
Speed matters, but transparency matters more. A platform that communicates clearly and processes reliably often deserves more trust than one making aggressive speed claims that fail under scrutiny.
For sweepstakes casinos, this phase may also include review of prize-redemption processes, user communication, identity checks, and practical wait times.
Phase Five: Compliance, Safety, and Responsible Gaming
A platform should not be rewarded solely because it is entertaining. Safety and responsibility matter.
Our methodology includes reviewing visible terms, account protections, self-limitation tools, self-exclusion pathways, privacy standards, and how clearly responsible gaming resources are presented.
We also evaluate whether promotional language feels fair and understandable rather than misleading or intentionally obscure.
Readers can explore broader safer-play guidance through the BestOdds Responsible Gaming resource.
Editorial Independence
Commercial relationships never guarantee positive coverage.
If an operator declines in quality, changes terms unfavorably, develops repeated support failures, or underperforms in retesting, scores may be reduced accordingly.
Our commercial team does not dictate rankings. Editorial conclusions are based on evidence gathered during testing.
That independence is central to trust. Without it, methodology language is meaningless.
Continuous Re-Reviews and Updates
The gaming industry changes quickly. A review published once and ignored for a year is often outdated.
BestOdds revisits live reviews periodically and accelerates reassessment when meaningful events occur, such as:
- Ownership changes
- Major app redesigns
- Payment disruptions
- Promotional overhauls
- Regulatory developments
- Repeated user complaints
- Significant improvements or decline in service
This helps ensure readers are not relying on stale information.
Why Our Methodology Is Different
Many review pages are written to convert clicks. Ours are written to withstand scrutiny.
We prioritize long-term use over first impressions. Real functionality over marketing language. Repeat testing over assumptions. Multi-factor scoring over simplistic rankings. Independence over convenience.
That does not mean perfection is claimed. It means the process is built to be serious, transparent, and continuously improved.
The BestOdds Promise to Readers
Our responsibility is not to tell readers what to choose blindly. It is to give them credible, tested, balanced information so they can choose intelligently.
Every review should answer the practical questions users actually care about:
Is the platform easy to use?Does it treat users fairly?Do promotions hold real value?Is support dependable?Does quality last beyond the first week?Would we trust recommending it to someone close to us?
If the answer is no, the score reflects that.
In Summary
BestOdds methodology combines:
- Extended real-world testing
- Multi-device usage
- Support and payments analysis
- Long-term reliability checks
- Responsible gaming review
- Weighted scoring standards
- Ongoing reassessment
- Editorial independence
The aim is simple: insight over hype, evidence over marketing, and clarity over noise.
For almost two decades, Sadonna has remained at the forefront of the gambling industry in the US and abroad, covering the latest news and legal updates. Sadonna’s goal is to provide sports bettors and casino players with premium content, including comprehensive details on the US industry.